When considering real estate appraisal values, it is also essential to understand hazard maps.
In this article, we will explain the role of hazard maps and their relationship with property valuation.
■ What is a hazard map? What can we learn from a hazard map? ■
When heavy rainfall or extreme weather causes natural disasters, we often hear the term hazard map in news reports. But what exactly is a hazard map, and what kind of information does it provide?
In simple terms, a hazard map is a map that predicts the areas likely to be affected by natural disasters.
Japan has long been prone to natural disasters such as earthquakes, floods, and volcanic eruptions. Based on past disaster data, hazard maps are created to indicate areas that could potentially be affected by future disasters. Their role is to raise awareness among local residents and help reduce potential damage.
Hazard maps typically show information such as:
- Predicted points of disaster occurrence
- The scope and severity of expected damage
- Evacuation routes
- Evacuation sites
These details are usually color-coded for easy understanding. Hazard maps can be accessed by anyone through municipal disaster-prevention websites or via the Ministry of Land, Infrastructure, Transport and Tourism (MLIT).
For example, on the “Hazard Map Portal Site” operated by MLIT, when checking flood and inundation risks in Sumida Ward, Tokyo, the system displays maps showing the areas at risk of water-related disasters.
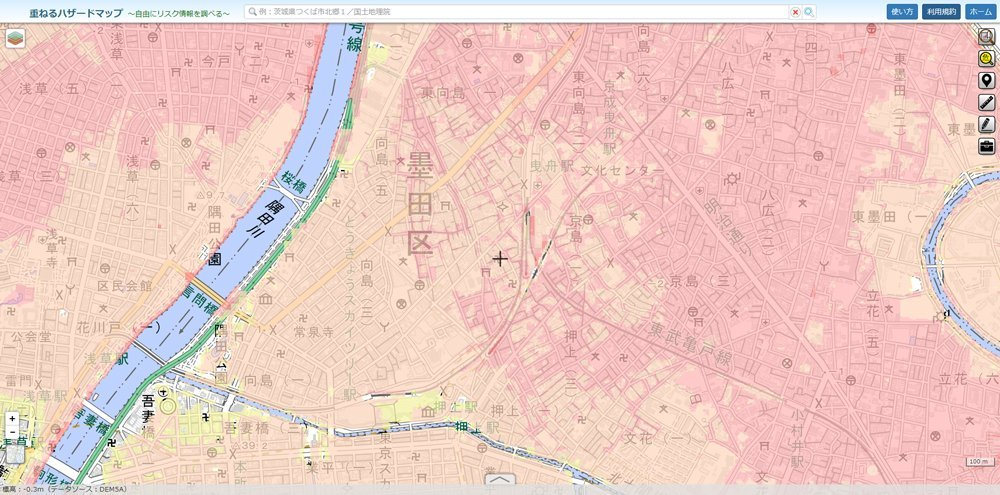
Source: Hazard Map Portal Site, Ministry of Land, Infrastructure, Transport and Tourism (MLIT), Japan
The areas shown in yellow or red on the map indicate places that may be flooded in the event of a heavy rainfall or river overflow.
In addition to flood zones, hazard maps also visualize and provide information on various other natural disaster risks, such as landslides and tsunamis.
■ What Can Be Learned from Hazard Maps! What Is Their Relationship with Real Estate Valuation? ■
Hazard maps are useful because they allow people to “accurately recognize risks that can affect human life” and to “monitor whether authorities are taking appropriate measures in high-risk areas.” Additionally, when using hazard map information in real estate appraisal, it is possible to predict and assess factors related to natural environmental conditions in property pricing based on objective evidence and data as much as possible.
For example, let’s look at evaluating real estate in relation to earthquake risk.
The rate of earthquake damage is…
Earthquake damage rate = Earthquake occurrence rate × Housing collapse rate × Rate of human casualties caused by collapse
This can be quantified using the following formula.
For the “earthquake occurrence rate,” data can be obtained from the “Seismic Hazard Map” published by the Headquarters for Earthquake Research Promotion. The “housing collapse rate” can be assessed based on the building’s seismic resistance and the likelihood of collapse. Meanwhile, the “rate of human casualties caused by collapse” depends on the level of disaster preparedness awareness in the area. Earthquake risk is already widely applied in real estate securitization, allowing for predictions and numerical evaluations of building seismic performance and potential damage based on the assumed maximum loss rate.
On the other hand, for certain types of natural disasters, predicting damage can be difficult. Take flood damage, for example. Recent sudden heavy rains and flooding have caused damage even in areas previously considered low-risk, making flood prediction extremely challenging.
However, even for such difficult-to-predict floods, it is possible to check in advance which areas a property belongs to by using inundation maps on flood hazard maps.
■ Does a hazard map have an impact on real estate prices or land values? ■
How does visualizing disaster risks through the publication of hazard maps affect real estate prices? Here is a detailed explanation.
How much do land prices decline due to the publication of hazard maps?
In conclusion, “the publication of hazard maps has little to no impact on land prices.” This is because various disaster risks are already taken into account in standard real estate appraisals.
For example, consider land prices in Sendai City, Miyagi Prefecture. Even though Sendai suffered significant damage during the Great East Japan Earthquake, some areas saw land prices rise afterward. This increase may not only be due to Sendai being an urban area, but also because reconstruction led to city development and an expectation that disaster prevention measures would be strengthened more than before.
However, some buyers may use disaster information as a reason to request discounts or raise complaints. To prevent such issues and ensure a smooth transaction, it is important to consult with a real estate agent about “where the property is located on the hazard map” and “how its position on the hazard map may affect the sale price.”
■ Mandatory Disclosure of Property Location on Flood Hazard Maps ■
In late August 2020, the Ministry of Land, Infrastructure, Transport and Tourism amended part of the Enforcement Regulations of the Real Estate Transaction Act to make it mandatory to explain the location of a property on flood hazard maps. While disaster risks such as landslides and tsunamis have already been included as items in the “important matters explanation,” flood risks were previously excluded. Following the regulation amendment, real estate agents are now required to explain a property’s disaster risks using flood hazard maps created by local governments.
This regulatory change stems from the increasing occurrence of large-scale flood disasters in recent years. Going forward, information about flood risks is expected to become an important factor in decision-making during real estate transactions. Although disasters such as floods or tsunamis are unlikely to significantly reduce land prices, it remains essential when selecting properties to understand the characteristics of the area—including hazard maps—and to analyze publicly available land price trends.
